Lidar Measurements from 16th April 2010
Leosphere Aerosol Lidar - Cardington
(scroll down or click here for Elight Aerosol and Ozone Lidar or here for Water Vapour Lidar measurements)
-new.png)
Figure 1: Plot showing how much of transmitted light is reflected back (multiplied by height-squared)
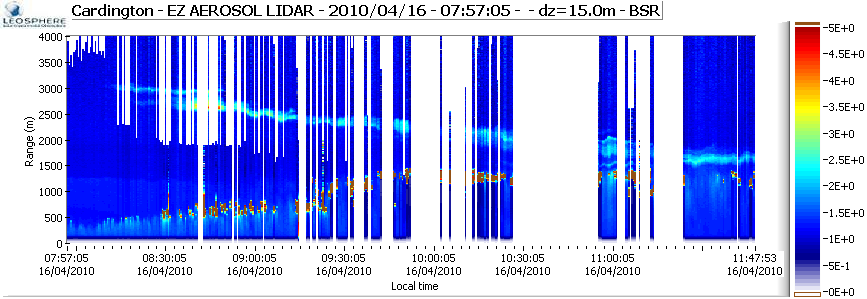
Figure 2: Plot showing where aerosol is reflecting light (backscatter ratio)
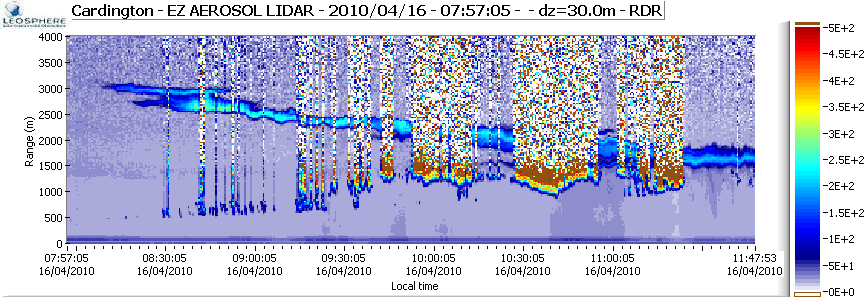
Figure 3: Plot showing depolarisation ratio. This indicates the shape of the particles (the higher the ratio the more irregularly-shaped they are).
Elight Aerosol and Ozone Lidar - Aberystwyth
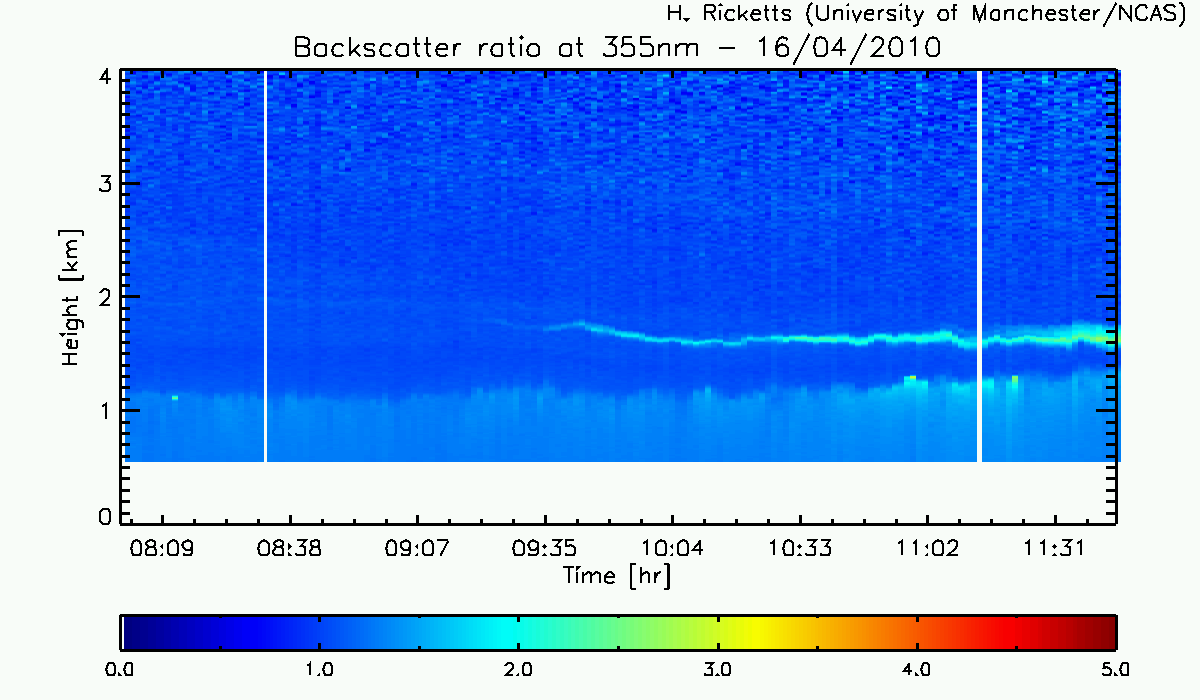
Figure 4: Plot showing backscatter ratio (with similar colour scale to Figure 2)
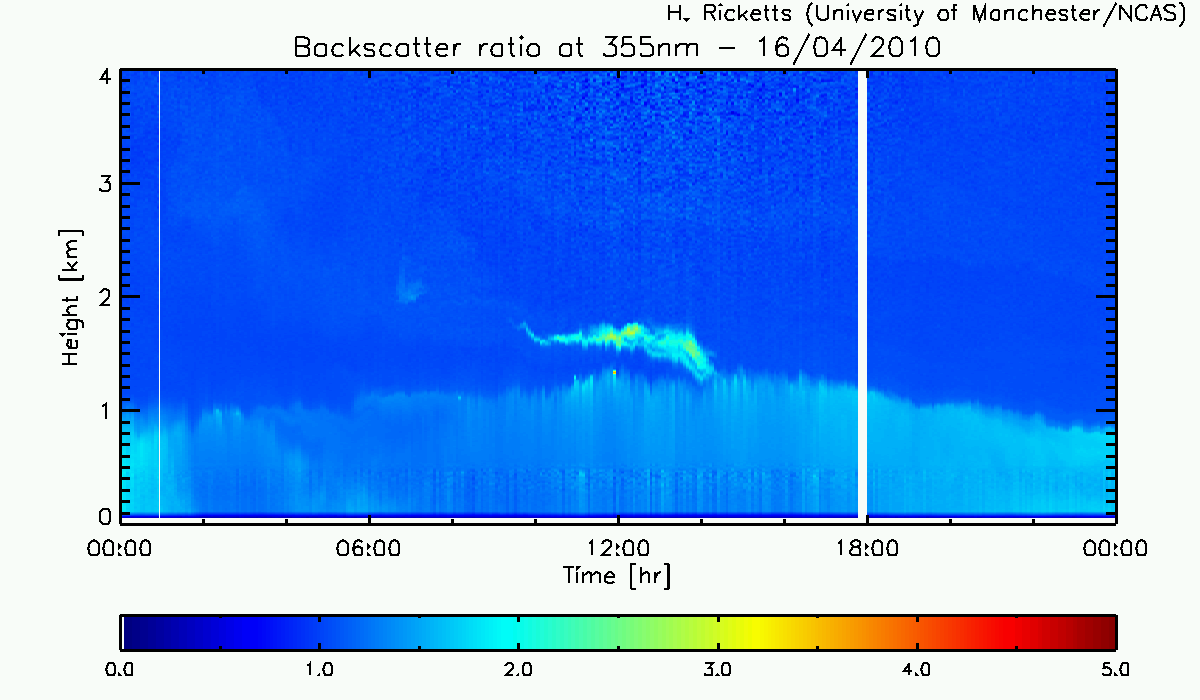
Figure 5: As Figure 4 but for the whole day.
Water Vapour Lidar - Aberystwyth
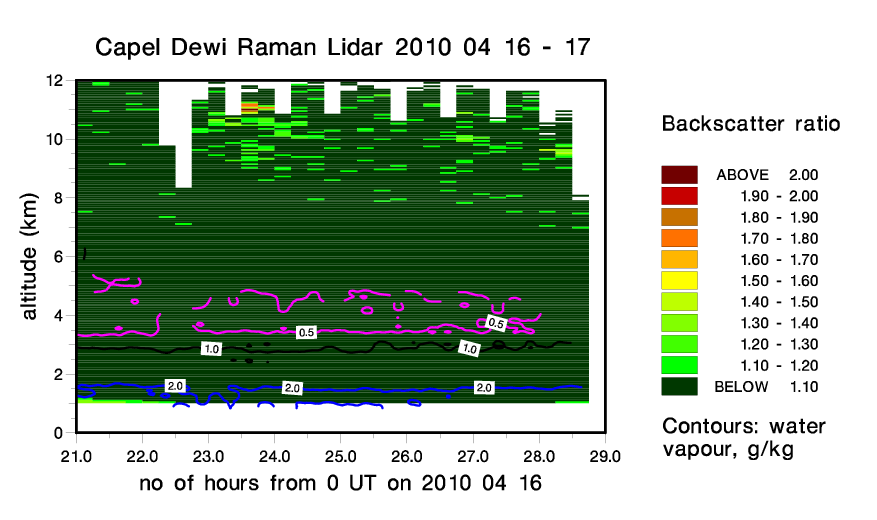
Figure 6: Plot showing backscatter ratio with contours of water vapour mixing ratio.
Last updated by H. Ricketts on 14th May 2010