Holme Moss PROCLOUD Results
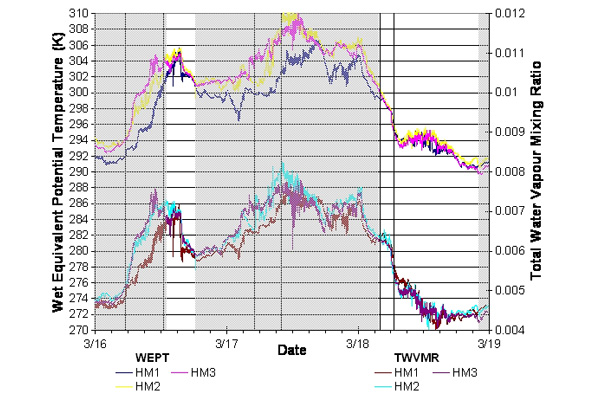
Figure 1. Thermodynamic connected flow analysis, showing periods of connected flow, and disconnection of HM1. Greyed out portions of the plot are disconnected, and cover Runs 2 and 3 (runs indicated by vertical lines)