Trace gas measurements in New York
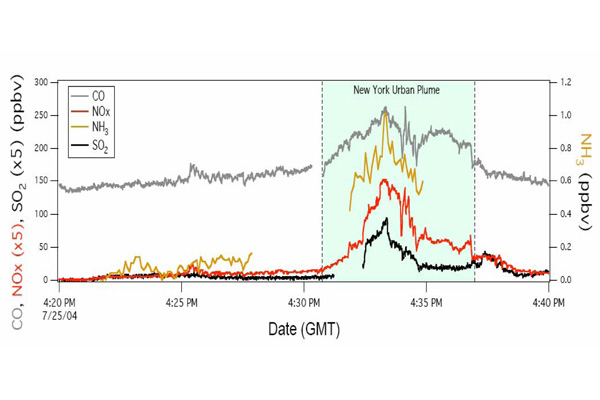
Fig 1. The time series of 1 s CO, NOx, SO2 (left axis) and 5 s NH3 (right axis) observations sampling the urban outflow from New York, taken from Nowak et al., 16
This website will look much better in a web browser that supports web standards, but it is accessible to any browser or Internet device.